Nagios
Nagios is the industry standard in IT infrastructure monitoring
Nagios offers complete monitoring and alerting for servers, switches, applications, and services.
Nagios官方宣称nagios是IT基础监控的工业标准。
Nagios提供对服务器,交换机,应用和服务的完整的监控和警报。
Nagios是无agent的,nagios的plugin通过协议远程获取信息。
https://github.com/NagiosEnterprises
https://github.com/nagios-plugins
Nagios安装配置
Nagios发展
Nagios core 1.0
Nagios core 2.0
Nagios core 3.0
Nagios XI
Nagios core 4.0
目前nagios有两大阵营:
开源解决方案: Nagios core
商业解决方案: Nagios XI
Nagios安装配置
安装和配置nagios core,plugins,addons参考
官方文档:
https://assets.nagios.com/downloads/nagioscore/docs/nagioscore/4/en/toc.html
中文文档:
http://nagios-cn.sourceforge.net/nagios-cn/index.html
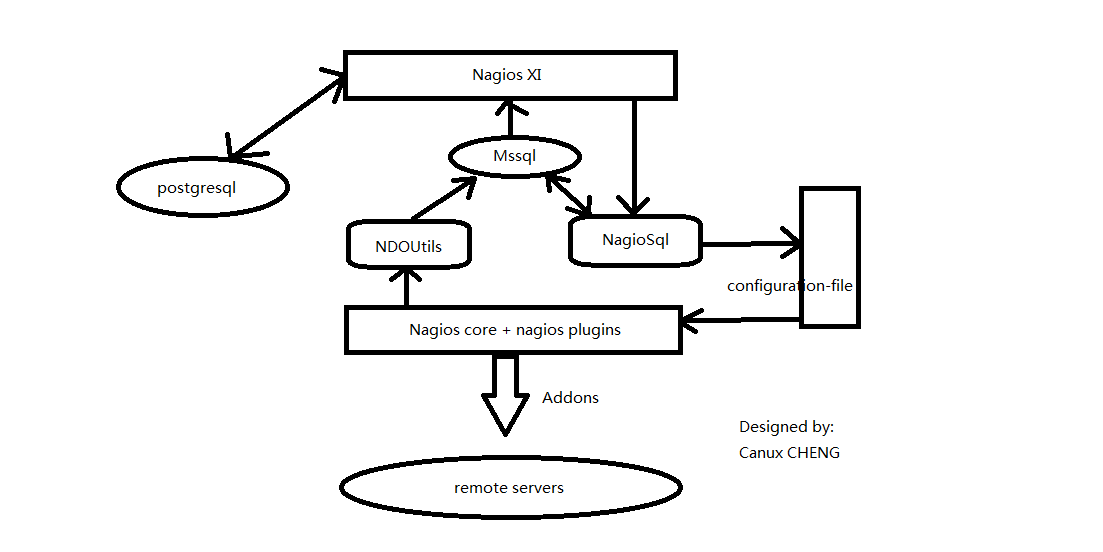
Nagios开源解决方案
Nagios core:
Nagios Core is the monitoring and alerting engine that serves as the primary application around which hundreds of Nagios projects are built.
Nagios core是监控和警报的主引擎,围绕它建立了成千上万的项目。 技术栈是c,只能安装在linux/unix系统。 Nagios core只是一个监控套件,本身没有监控功能,需要插件来完成监控。
https://www.nagios.org/projects/nagios-core/
https://github.com/NagiosEnterprises/nagioscore
Nagios plugins:
Efficient, standalone extensions that provide low-level intelligence for monitoring anything and everything with Nagios Core.
Nagios core的监控插件,也就是官方插件,主要是c、shell和perl。
https://www.nagios.org/projects/nagios-plugins/
https://github.com/nagios-plugins/nagios-plugins
Nagios frontends:
Web interfaces, themes, Windows and Linux interfaces, and mobile apps for Nagios. Change the look and style of Nagios to suite your needs.
Nagios frontends包括了 主题,web接口,移动设备接口。
https://www.nagios.org/downloads/nagios-core-frontends/
Nagios config tools(Nagios addons projects):
Tools and GUIs for simplifying Nagios Core configuration.
nagios core的组件。
包括Lilac,NagiosQL,NConf,OneCMDB,ignoramus
https://www.nagios.org/projects/nagios-config-tools/
https://www.nagios.org/downloads/nagios-core-addons/
https://github.com/NagiosEnterprises
Nagios exchange:
Nagios® Exchange is the central place where you’ll find all types of Nagios projects - plugins, addons, documentation, extensions, and more. This site is designed for the Nagios Community to share its Nagios creations.
Nagios exchange是nagios的开源宝库。
包括第三方plugins、addons和docs。
https://exchange.nagios.org/https://exchange.nagios.org/
Nagios商业解决方案
Nagios XI:
Our most powerful IT infrastructure monitoring and IT monitoring software alerting solution for today’s demanding organizational requirements.
Nagios XI 是现代化的商业监控解决套件。
Nagios XI 使用nagios core 4.0。
Nagios XI 架构:
Nagios network analyzer
Nagios log server
Nagios fusion
Nagios incident manager
Nagios命令
/usr/local/nagios/bin/nagios --help
-v 验证配置文件
-d daemon mode
-W worker mode.
Nagios 集中监控
本地监控
使用nagios core + plugins只能监控本地的linux/unix机器。
远程监控
使用nagios core + plugins + addons可以监控远程的linux/unix/windows机器。
NRPE(for linux)/NRPE_NT(for windows)和check_nrpe, 运行远程机器上的插件, 支持windows/unix/linux:
nagios core + check_nrpe <=> NRPE/NRPE_NT + plugins
NSCP和check_nt, 只能使用固定的几个命令查基本属性, 支持windows/linux/unix:
nagios core + check_nt -H <NSCP IP> [-v <command>] <=> NSCP(NSClient++)
NSCP和check_nrpe,可以传自己的命令或插件, 支持windows/linux/unix:
nagios core + check_nrpe -H <NSCP IP> [-c <command/plugins>] [-a <argument list>] <=> NSCP(NSClient++) + plugins
NSCP和NSCA/NRDP,NSCP主动check,然后将结果发送给NSCA/NRDP:
nagios core + NSCA <=> NSCP(NSClient++)
NCPA是python写的跨平台代理, 支持linux/windows/unix:
nagios core + check_ncpa.py <=> NCPA
Nagios 分布式监控
NRDP/NSCA/NSCA-ng
官方推荐,NRDP是NSCA的升级版,提供被动检测,这种方式效率低,稳定性差。
nagios core <- plugins <- NSCA <= send_nsca <- ocsp <- Nagios core <=> Hosts
                               ^
                              ||
                              send_nsca <- ocsp <- Nagios core <=> Hosts
Nagios的组件
https://www.nagios.org/downloads/nagios-core-addons/
https://github.com/NagiosEnterprises
NDOUtils(NDO)/IDOUtils(IDO)
从nagios导出当前和历史数据到mysql数据库,需要安装数据库。
相似功能有mk livestatus。
N * (Nagios core + NDO module) -> TCP/Socket -> NDO2DB daemon -> DB
https://github.com/NagiosEnterprises/ndoutils
NSTI
Nagios SNMP Trap Interface.
https://github.com/NagiosEnterprises/nsti
BPI
Nagios Business Process Intelligence.
https://github.com/NagiosEnterprises/nagiosbpi
其它组件介绍
NCONF
nagios的基于web的配置工具。
http://www.nconf.org/dokuwiki/doku.php
https://github.com/nconf/nconf
DNX
分布式组件。
https://sourceforge.net/projects/dnx/
Nagiosgraph
nagiosgraph parses output and performance data from Nagios plugins and stores the data in RRD files. nagiosgraph creates graphs and generates HTML pages with graphic reports from the data.
基于RRD,绘制nagios的性能图。
http://nagiosgraph.sourceforge.net/
https://sourceforge.net/projects/nagiosgraph/
consol的分布式监控方案
一家德国的咨询和解决方案软件公司。
可以通过 check_MK 的omd来安装。
https://labs.consol.de/index.html
主要贡献组件:
主要贡献插件:
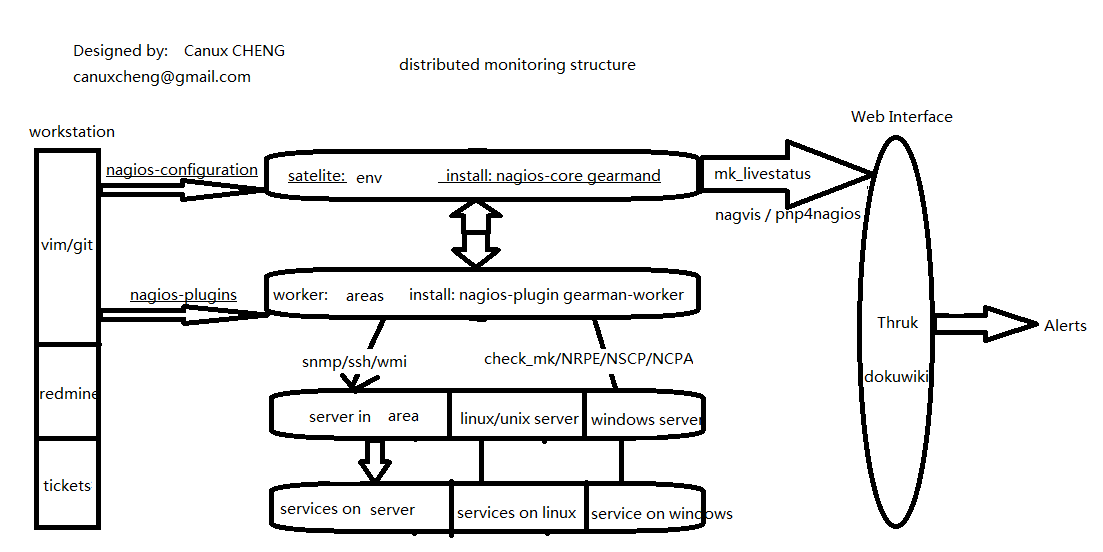
Mod gearman
labs consol的分布式监控组件, gearman的worker。
https://github.com/sni/mod_gearman
NDOUtils/livestatus
Event broker.
Thruk
基于perl的web框架catalyst的dashbord。
Op5的分布式监控方案
一家瑞典的监控和解决方案公司。
https://kb.op5.com/dashboard.action
merlin
分布式组件。
https://kb.op5.com/display/MERLIN/Distributed+%28Merlin%29+Home
NDOUtils/MK livestatus
Eevent broker
Ninja
Dashboard.
https://kb.op5.com/display/GUI/GUI+%28Ninja%29+Home
介绍Addons.
OMD
OMD implements a completely new concept of how to install, maintain and update a monitoring system built on Nagios.
http://git.mathias-kettner.de/git/?p=omd.git;a=tree
The Open Monitoring Distribution
用于快速部署基于nagios的分布式监控,包括:
Icinga/Shinken/check_MK
Monitoring-Plugins和其它插件
mod-gearman/MK Livestatus/thruk/multisite
nsca/check_nrpe。
NagVis/Pnp4nagios/rrdtool/dokuwiki
Gearman
Gearman provides a generic application framework to farm out work to other machines or processes that are better suited to do the work.
Gearman用来做任务分发的.
一个C++实现的Gearman Job Server:
https://github.com/gearman/gearmand
一个C实现的Gearman worker:
https://github.com/sni/mod_gearman
rrdtools
RRDtool is a little program for easily maintaining a database of time-series data. It comes with a charting program for drawing pretty graphs based on the data stored.
存储性能数据。
http://oss.oetiker.ch/rrdtool/
https://github.com/oetiker/rrdtool-1.x
pnp4nagios
PNP is an addon to Nagios which analyzes performance data provided by plugins and stores them automatically into RRD-databases.
基于RRD,绘制nagios的性能图。
https://github.com/lingej/pnp4nagios
可以在nagios的service配置中添加“ostpl_enable-graph"启用图形。
templates.dist是自带模板
templates是用户自定义模板
XXX.php需要和nagios的service的command_name同名,默认查找这个同名的模板.
测试就是scp XXX.php nagios-server:/usr/share/pnp4nagios/html/templates/然后去nagios查看结果
pnp4nagios查找顺序:
- templates/check_XXX.php
- templates.dist/check_XXX.php
- templates/default.php
- templates.dist/default.php
Nagvis
NagVis is a program for visualizing the data the monitoring core of your choice, for example Nagios, Naemon, Icinga or Shinken, in a human friendly way.
绘制监控地图。
https://github.com/NagVis/nagvis
dokuwiki
DokuWiki is a simple to use and highly versatile Open Source wiki software that doesn’t require a database.
创建监控的procedure。
https://www.dokuwiki.org/dokuwiki/
https://github.com/splitbrain/dokuwiki
graphite
https://github.com/graphite-project
http://graphite.readthedocs.io/en/latest/index.html
Zabbix,Sensu,Ganglia,Nagios/Naemon/Icinga/Shinken都可以配合使用。
绘制性能图。
graphite-web
A highly scalable real-time graphing system
carbon
Carbon is responsible for receiving metrics over the network, caching them in memory for “hot queries” from the Graphite-Web application, and persisting them to disk using the Whisper time-series library.
whisper/ceres
ceres会替代whisper。
Whisper is a fixed-size database, similar in design and purpose to RRD (round-robin-database). It provides fast, reliable storage of numeric data over time. Whisper allows for higher resolution (seconds per point) of recent data to degrade into lower resolutions for long-term retention of historical data.
grafana
Grafana is an open source, feature rich metrics dashboard and graph editor for Graphite, Elasticsearch, OpenTSDB, Prometheus and InfluxDB.
为graphite提供更好的可视化图形。
https://github.com/grafana/grafana
graphios
A program to send nagios perf data to graphite(carbon)/statsd/librato/influxdb
发送nagios性能数据到Graphite。
https://github.com/shawn-sterling/graphios
Ledbetter
A simple script for gathering Nagios problem statistics and submitting them to Graphite. It focuses on summary (overall, servicegroup and hostgroup) statistics and writes them to the nagios.problems metrics namespace within Graphite.
发送nagios性能数据到Graphite。
https://github.com/github/ledbetter
NSCP
NSClient is an agent designed originally to work with Nagios but has since evolved into a fully fledged monitoring agent which can be used with numerous monitoring tools (like Icinga, Naemon, OP5, NetEye Opsview etc).
又叫NSClient++,现在同时支持windows和linux,主要用来安装到windows服务器,用于监控windows系统.
https://github.com/mickem/nscp
介绍Plugins
Monitoring Plugins
Nagios/naemon/icinga/shinken/centreon/opsview/sensu
Office project:
https://github.com/monitoring-plugins
https://www.monitoring-plugins.org/
My plugin project:
https://github.com/crazy-canux/pymonitoringplugins
Open source project:
https://github.com/crazy-canux/awesome-monitoring
monitoring-plugins
negate
设置相反状态
-o 设置ok对应状态
-w
-c
-u
check_http
[-f <ok|warning|critcal|follow|sticky|stickyport>] # 跳转
-p PORT # http:80, https:443
-a "USERNAME":"PASSWORD"
-u PATH
--ssl=1/-S # https需要ssl
-s SEARCH
-e SEARCH,SEARCH...
-l # 用在-r或-R前面,表示可以在多行进行正则匹配
-r # 正则匹配
-R # 大小写不敏感的正则匹配
-C # 检查证书, 不检查URL
-t # timeout.
-w # warning response time
-c # critical response time
Windows monitoring
check_wmi_plus.pl
  IgnoreMyOutDatedPerlModuleVersions
  -m checkfolderfileage -a 'C:' -o '/tmp' -inc _FileAge=@0:1000 -c 10
  -m check_file_count -a 'F:' -o '/folder'
check_snmp_win_services.pl
查windows的service
  -n <name>[,<name2>]... # 指定service名字,默认大小写不敏感,正则匹配,逗号分隔多个service,用display name。
  -N=<n> # 匹配到service数量大于n就报错
  -r # 精确匹配
check_smb_shares.pl
Linux/Unix monitoring
- check_hpasm.pl
OS X monitoring
- OSX-Monitoring-Tools
Vitual Machine monitoring
check_wmware_api.pl
check_vmware_esx.pl
DB monitoring
check_mysql_health.pl
check_oracle_health.pl
check_db2_health.pl
check_mssql_health.pl
--name database/sql
Network monitoring
- check_nwc_health.pl
Storage monitoring
check_snmp_storage.pl
返回用了多少空间。
check_disk
返回剩余多少空间。
Log monitoring
check_logfiles.pl
check_events.pl
Process monitoring
check_snmp_process.pl
  -n <name> # process名字,大小写敏感,正则匹配,windows需要用processname.exe
  -r # 精确匹配
  -w minW, maxW
  -c minC, maxC # minC <= minW < maxW < maxC
Application monitoring
check_sap_health.pl
check_mailbox_health.pl
Monitoring插件开发
Nagios Plugin API:
https://assets.nagios.com/downloads/nagioscore/docs/nagioscore/3/en/pluginapi.html
Developing Plugins For Use With Embedded Perl:
https://assets.nagios.com/downloads/nagioscore/docs/nagioscore/3/en/epnplugins.html
Nagios plugin development guidelines:
https://nagios-plugins.org/doc/guidelines.html
Monitoring Plugin Development Guidelines:
https://www.monitoring-plugins.org/doc/guidelines.html
Nagios不是基于agent的,所以插件都是通过协议来获取监控信息。
plugin需要遵守下面规则:
- 至少输出一行文本到STDOUT
- 事件状态由插件的返回码决定
输出:
just support 4kb data
shortoutput - $SERVICEOUTPUT$
perfdata - $SERVICEPERFDATA$
longoutput - $LONGSERVICEOUTPUT$
返回码:
0: OK(绿色)
1: Warning(黄色)
2: Critical(红色)
3: Unknown(深黄色)
阀值:
10     | 0:10   | <0 or >10 alert
10:    | 10:æ  | <10 alert
~:10   | -æ:10 | >10 alert
10:20  |        | <10 or >20 alert
@10:20 |        | >=10 and <=20 alert